XTRAN Example — Analyze Straight-line Code Length by Nesting Depth
In structured computer languages, a sequence of statements at the same nesting level is known as a "straight-line code" (SLC) segment or run.
Code quality
One property of SLC runs is that, if one gets very long, the code becomes harder to understand, because:
- You can't see the entire segment on one screen.
- You can't see the beginning and end of higher-level constructs in which the SLC run occurs.
So an analysis of SLC run lengths can be a valuable code quality measure.
Forensic Analysis
Another interesting property of SLC runs is that, if someone copies a body of code and attempts to conceal the theft by making minor modifications to the code or otherwise obfuscating it, the thief almost never disturbs the code's structure, since that would require re-engineering and debugging. As a result, the frequency of SLC run lengths at given nesting depths is unlikely to change appreciably.
Similarly, if a nefarious hacker copies existing malware and changes it to avoid detection by anti-malware facilities, the chances are that the copy's distribution of SLC run lengths by nesting depth will not change significantly.
So an analysis of two bodies of code that results in an identical or highly similar distribution of such occurrences is very likely to indicate code copying. It is extremely unlikely that independently developed code would be that close. This means that such analysis can be a valuable forensic analysis tool when looking for code theft or common code authorship.
Example
The following example uses a set of XTRAN rules comprising 59 non-comment lines of XTRAN's rules language ("meta-code"). The rules took ½ hour to write and ½ hour to debug. (That's right, only 1 hour total!)
The XTRAN rules used for this example are totally language-independent; they can be used unchanged for any language XTRAN accommodates.
These XTRAN rules analyze code (C in this example) and tally the occurrences of SLC run lengths by code nesting depth. They then output the results as delimiter-separated values (DSV), which is a format suitable for input to a spreadsheet, data base, or statistics software, in the following format:
<dpth><dlm><lgth><dlm><tally>
where:
<dlm> |
is the DSV delimiter character; defaults to comma | |
<dpth> |
is the code nesting depth, in numeric order | |
<lgth> |
is the SLC run length, in numeric order
within <dpth> |
|
<tally> |
is the tally of <lgth> runs
at <dpth> |
The following is an English paraphrase of the rules:
For each statement
    If it is at the end of an SLC
        Get SLC's run length (statements)
        Remember that this length occurred at this nesting depth
        Increment tally for this length at this depth
Create or append to output file
For each code nesting depth we saw, in numeric order
    For each SLC run length we saw at this depth, in numeric order
        Output this run length's tally for this depth
Close output file
The actual analysis work is done by the initial "For" statement, which literally comprises 5 statements in XTRAN's rules language.
The code mining rules for this example can easily be enhanced
to produce DSV output that can be interactively queried using
existing XTRAN rules. ![]()
![]()
How can such powerful and generalized code quality analysis be automated in just 1 hour and only 59 code lines of XTRAN rules? Because there is so much capability already available as part of XTRAN's rules language. These rules take advantage of the following functionality:
- Text file input and output
- Text manipulation
- Text formatting
- Delimited list manipulation
- Environment variable manipulation
- Content-addressable data bases
- "Per statement" recursive iterator
- Creating new meta-functions written in meta-code, which we call user meta-functions
- Recursive user meta-functions
- Access to XTRAN's Internal Representation (XIR)
- XIR's language-independent properties
- Navigation in XIR
The input to and output from XTRAN are untouched.
Process Flowchart
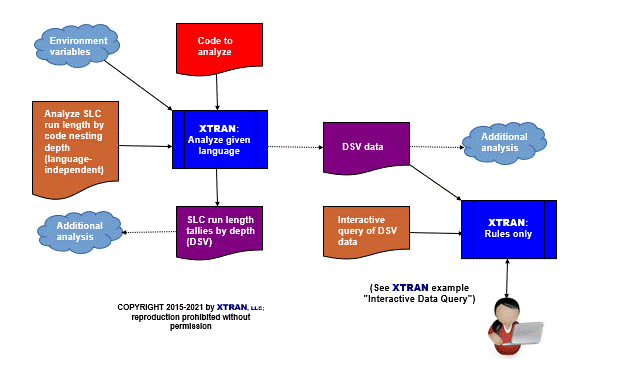
Here is a flowchart for this process, in which the elements are color coded:
- BLUE for XTRAN versions (runnable programs)
- ORANGE for XTRAN rules (text files)
- RED for
code - PURPLE for text data files

Input to XTRAN:
void proc1(void)
        {
        short s1, s2;
        long l1, l2;

        for (s1 = 0; s1 < 5; ++s1)
            {
            s2 = 1;
            s2 = 2;
            if (l1 > 3)
                {
                l2 = 1;
                l2 = 2;
                l2 = 3;
                }
            s2 = 3;
            s2 = 4;
            s2 = 5;
            if (l1 > 3)
                {
                l2 = 1;
                l2 = 2;
                l2 = 3;
                }
            }
        return;
        }
void proc2(void)
        {
        short s1, s2;
        long l1, l2;

        for (s1 = 0; s1 < 5; ++s1)
            {
            s2 = 1;
            s2 = 2;
            if (l1 > 3)
                {
                l2 = 1;
                l2 = 2;
                }
            s2 = 3;
            s2 = 4;
            s2 = 5;
            if (l1 > 3)
                {
                l2 = 1;
                l2 = 2;
                l2 = 3;
                }
            }
        return;
        }
Output from XTRAN:
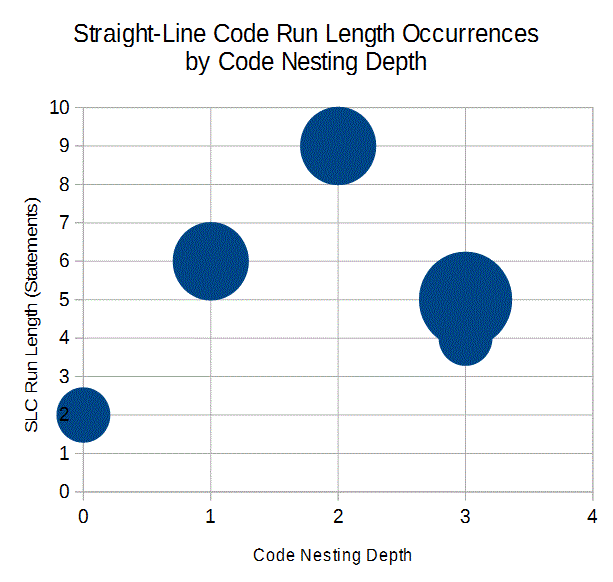
0,2,1
1,6,2
2,9,2
3,4,1
3,5,3
Importing those results into OpenOffice Calc, we quickly created the following bubble chart:
